
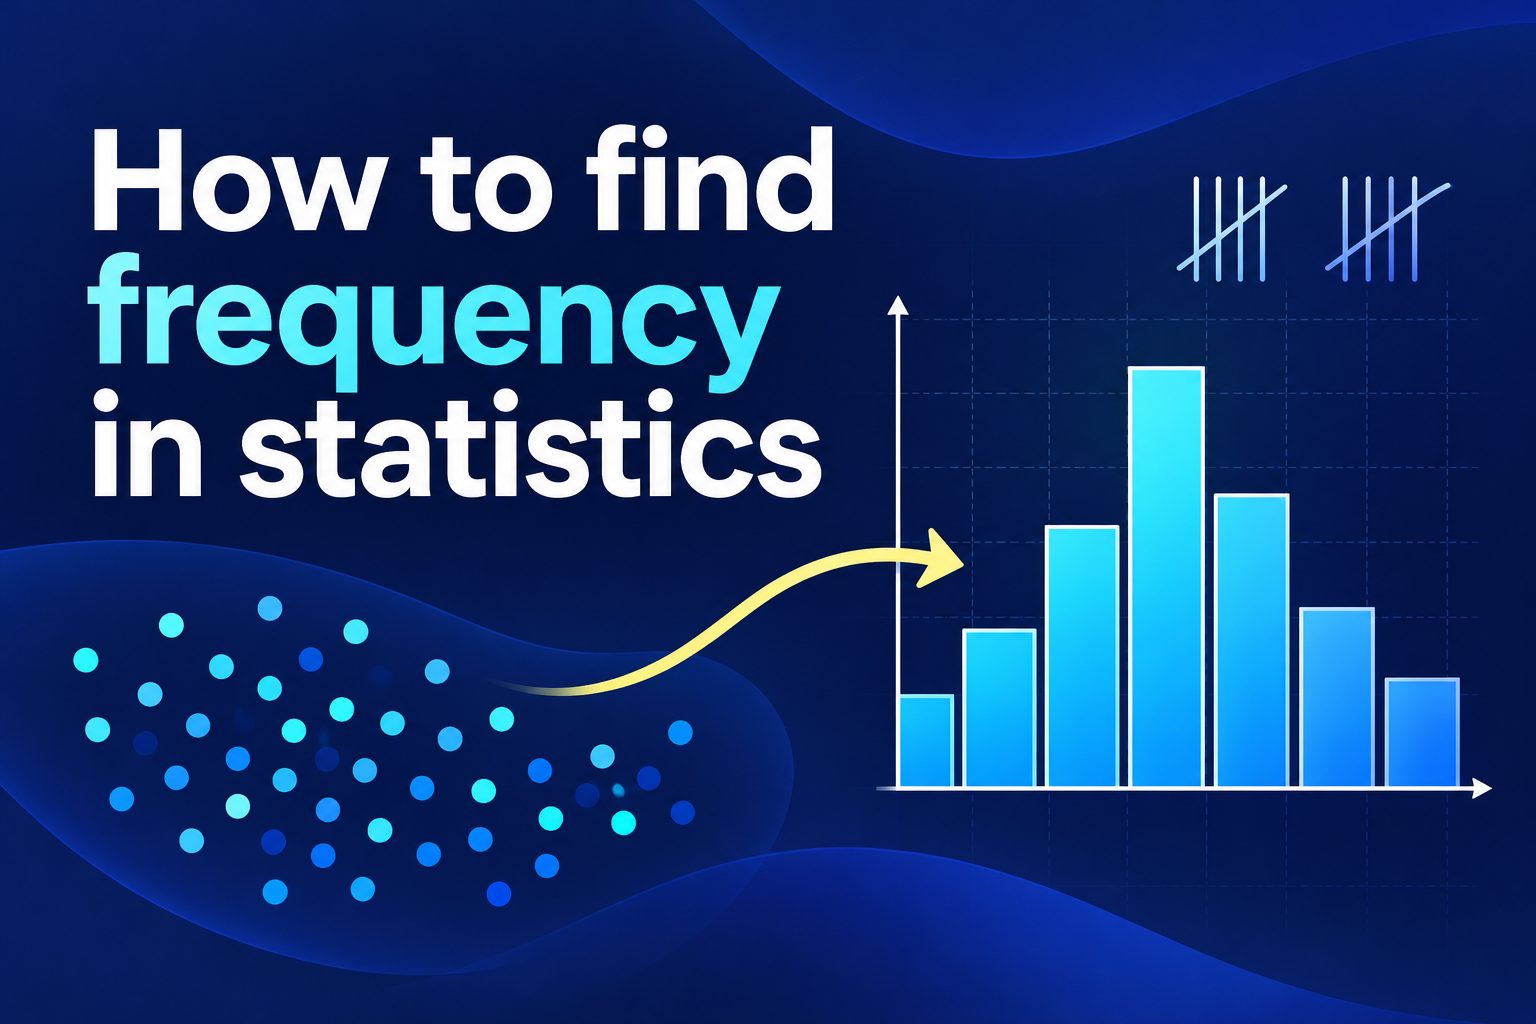
Learning how to find frequency in statistics is one of the simplest and most useful ways to turn a list of values into meaningful information. Frequency shows how often a value, answer, category, or event appears in a data set. It helps readers move beyond individual observations and quickly spot common patterns.
Whether you are reviewing test scores, survey answers, customer purchases, attendance records, or experiment results, frequency gives structure to raw data. A careful count can reveal what is typical, what is unusual, and where further analysis may be needed.
This guide explains the meaning of frequency, the steps for calculating it, ways to present it, common errors to avoid, and practical examples. You will also learn how frequency relates to relative frequency, cumulative frequency, and frequency tables.
Frequency is the number of times a particular value or category occurs in a set of observations. If the value 8 appears four times in a list of scores, its frequency is 4. The word count is often used in the same practical sense, especially with categories or text responses.
A frequency distribution organizes these counts so they are easier to read. Instead of scanning a long list repeatedly, you create a table that places each value or group beside the number of observations belonging to it. This is especially useful when a data set contains repeated values.
Frequency matters because it summarizes data without changing what was observed. It supports comparisons between categories, helps identify the mode, and provides the foundation for charts, percentages, probabilities, and many later statistical calculations.
The correct method depends on the type of data. Discrete numerical values, such as the number of pets owned, can usually be counted one by one. Continuous measurements, such as height or time, are commonly grouped into intervals called class ranges.
Before calculating anything, make sure the data is complete and consistently recorded. A missing response, duplicated row, or category written in two different ways can distort the count and lead to an inaccurate conclusion.
How Do You Find Frequency In Statistics?
Collect And Review The Data
Start by gathering the observations you want to study and reading through them once. Check that every item belongs to the same question or measurement. For example, do not combine ages with test scores or mix monthly sales with annual sales. A clean data set makes the counting process more reliable.
Identify Values Or Categories
Decide what will receive a count. For discrete numerical data, list each possible value that appears in the data. For categorical data, list each response group, such as yes, no, or undecided. Keep category names consistent so that similar responses are not counted separately by mistake.
Sort The Observations
Sorting numerical observations from lowest to highest often makes repeated values easier to see. Alphabetizing category labels can also help. Sorting is not always required, but it reduces the chance of overlooking an item and makes a frequency table easier for another person to check.
Use Tally Marks For Each Occurrence
Read each observation and add one tally mark beside its value or category. Grouping tally marks in sets of five can make manual counting faster. This approach is useful for small data sets because it creates a visible record of every count before you write the final frequency.
Count The Tallies
Convert the tally marks into numerical totals. Each total is the frequency for that value or category. Check that the frequencies add up to the total number of observations in the original data set. If they do not, review the list for a missed or duplicated observation.
Create A Frequency Table
Place the values or categories in one column and their frequencies in the next. A table makes the result easier to compare and prepares the data for a bar chart, histogram, or other visual display. Use a clear heading so readers know exactly what is being counted.
Interpret The Pattern
After finding frequency, look for the highest, lowest, and unusual counts. The category with the greatest frequency may be the mode. A value with a frequency of zero can also matter because it shows a possible outcome that did not occur in the observed sample.
What Types Of Frequency Are Used?
1. Absolute frequency is the basic count of how many times a value or category appears. It is usually what people mean when they ask for frequency in statistics.
2. Relative frequency expresses a count as a share of the total. Divide the frequency by the total number of observations to calculate it, then write the result as a decimal, fraction, or percentage.
3. Percentage frequency is relative frequency multiplied by 100. It is helpful when comparing groups with different sample sizes because raw counts alone may create a misleading impression.
4. Cumulative frequency adds frequencies as you move through ordered values or class intervals. It tells you how many observations are at or below a chosen point.
5. Grouped frequency combines continuous or numerous values into intervals, such as 10 to 19 or 20 to 29. This makes large data sets easier to summarize, though the individual values are no longer shown.
Why Frequency Tables Improve Data Analysis
- Clearer Summary: A frequency table condenses a long list of observations into a format readers can scan quickly and accurately.
- Faster Comparison: Counts make it easier to compare categories, values, or score ranges without repeatedly reviewing raw data.
- Better Charts: Bar charts, histograms, pie charts, and frequency polygons rely on organized frequency information.
- Pattern Detection: High and low counts can reveal clusters, gaps, trends, and potential outliers that deserve closer attention.
- Useful Decisions: Teachers, researchers, businesses, and health professionals can use frequency results to guide practical decisions.
- Reliable Checking: When frequencies total the sample size, they provide a simple check that the data was counted consistently.
Common Frequency Calculation Mistakes
Ignoring Duplicate Entries
Duplicate entries can inflate a frequency if they were copied accidentally rather than recorded as separate observations. Review the source data before counting and confirm whether repeated rows represent real events. Do not remove genuine repeated values simply because they look similar.
Combining Different Categories
Categories should be mutually clear. For example, responses labeled often and very often should not be merged unless the analysis plan says they belong together. Combining categories after counting can hide meaningful differences and makes results difficult to compare with the original data.
Using Overlapping Class Intervals
Grouped data needs intervals that do not overlap. If one range is 10 to 20 and the next is 20 to 30, the value 20 could be counted twice. Use clearly defined boundaries, such as 10 to 19 and 20 to 29, or state the inclusion rule.
Forgetting Zero Frequencies
A possible category with no observations should sometimes remain in the table, especially when comparing expected outcomes or survey options. Omitting it can make readers assume the category was never considered. A zero frequency is still useful information about the data.
Confusing Frequency With Percentage
Frequency is a count, while percentage frequency is a proportion of the total multiplied by 100. A category may have a frequency of 12 and a percentage frequency of 30 percent. Label table columns carefully so readers do not mistake one measure for another.
Failing To Check The Total
Always add the final frequencies and compare the sum with the original number of observations. This basic check catches many errors, including missed values, double counts, and entries placed in the wrong category. It should be completed before presenting a table or chart.
Drawing Conclusions Too Quickly
The highest frequency does not automatically prove a cause, predict every future result, or represent every population. Frequency describes the observed data. Consider sample size, collection method, and context before making a broad claim based only on the most common category.
Finding frequency in statistics begins with a careful count of how often each value or category appears. Sorting data, using tally marks, building a frequency table, and checking totals are simple habits that make the result more dependable.
Once the counts are organized, frequency can reveal common outcomes, rare observations, and useful comparisons. Relative, percentage, cumulative, and grouped frequency add further detail when the question calls for it.
The key is to keep categories clear, avoid double counting, and match the method to the data type. With those basics in place, frequency becomes an accessible starting point for stronger statistical analysis.
FAQs About Finding Frequency In Statistics
What Is Frequency In Statistics?
Frequency is the number of times a particular value, response, or category occurs in a data set. If a survey response appears 15 times, its frequency is 15. Frequency is a count, not a percentage, although it can be used to calculate percentages and other measures.
How Do You Calculate Relative Frequency?
Calculate relative frequency by dividing the frequency of a value or category by the total number of observations. For example, if 8 of 40 students choose the same answer, the relative frequency is 8 divided by 40, or 0.20. It can also be reported as 20 percent.
What Is The Difference Between Frequency And Cumulative Frequency?
Frequency counts one value or category at a time. Cumulative frequency adds the current frequency to all earlier frequencies in an ordered list or grouped table. It shows how many observations fall at or below a certain value, which is helpful for locating positions and percentiles.
Can Frequency Be Zero?
Yes, a frequency can be zero when a possible value or category does not appear in the observed data. Including zero-frequency categories can be important when reporting all survey options, comparing expected and observed outcomes, or showing that a particular event did not occur during the study.
When Should Data Be Grouped Into Intervals?
Group data into intervals when there are many unique numerical values or when measurements are continuous, such as height, weight, time, or temperature. Intervals make patterns easier to see, but they should be equal where practical, clearly labeled, and designed without overlapping boundaries.
How Can You Check A Frequency Table?
Add every frequency in the table and confirm that the total equals the number of original observations. Then compare several entries against the raw data, check category spelling and interval boundaries, and make sure each observation was assigned to exactly one category. These checks catch most counting errors.